iHeart Media 100kW ERP FM Services From Miami Andover Tower

I'm Paul Hollings and one of my jobs at Aareff Systems is to produce plots of coverage areas usually for FM services around the world, but it can actually be any radio frequency service. These plots make it much easier for the customer to plan their installation in terms of cost and compliance with the regulator.
If you need plots like this for your planning and proposals, just let me know, message me via LinkedIn
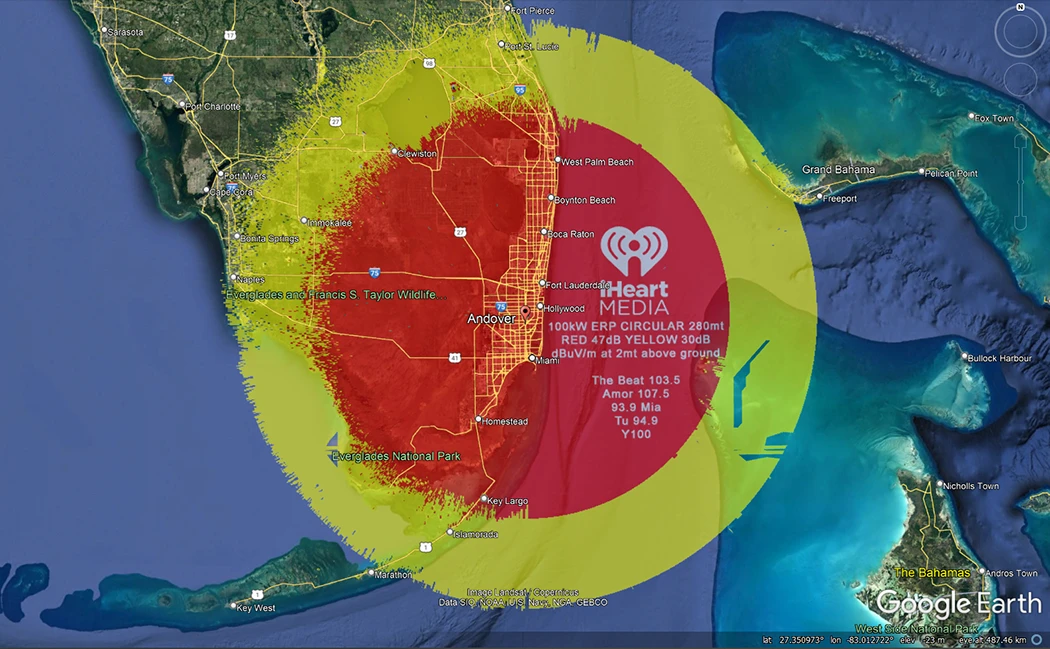
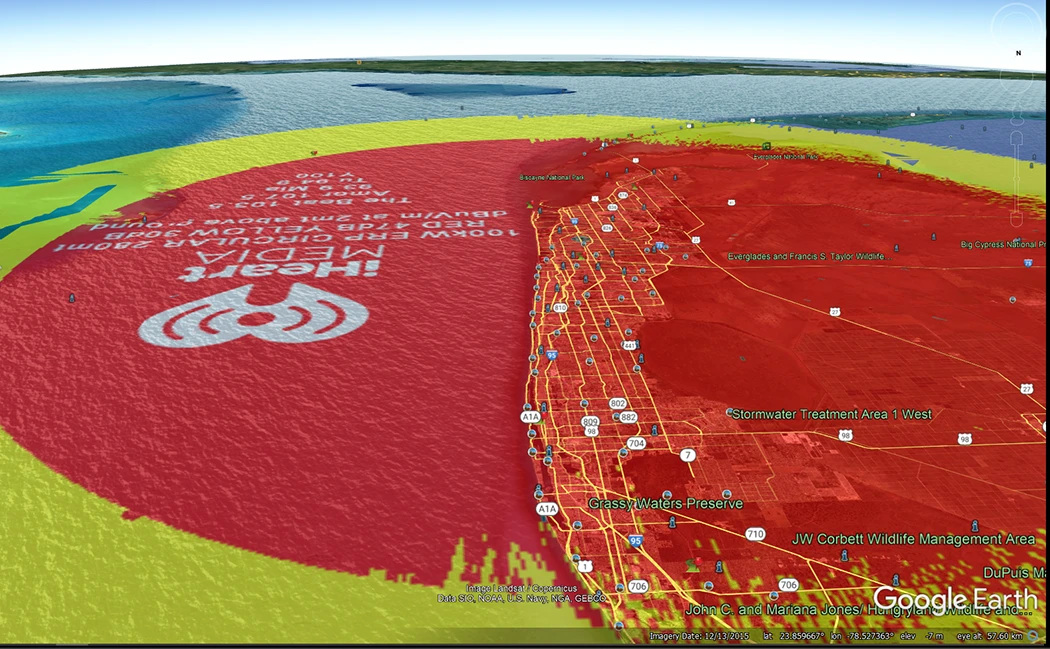
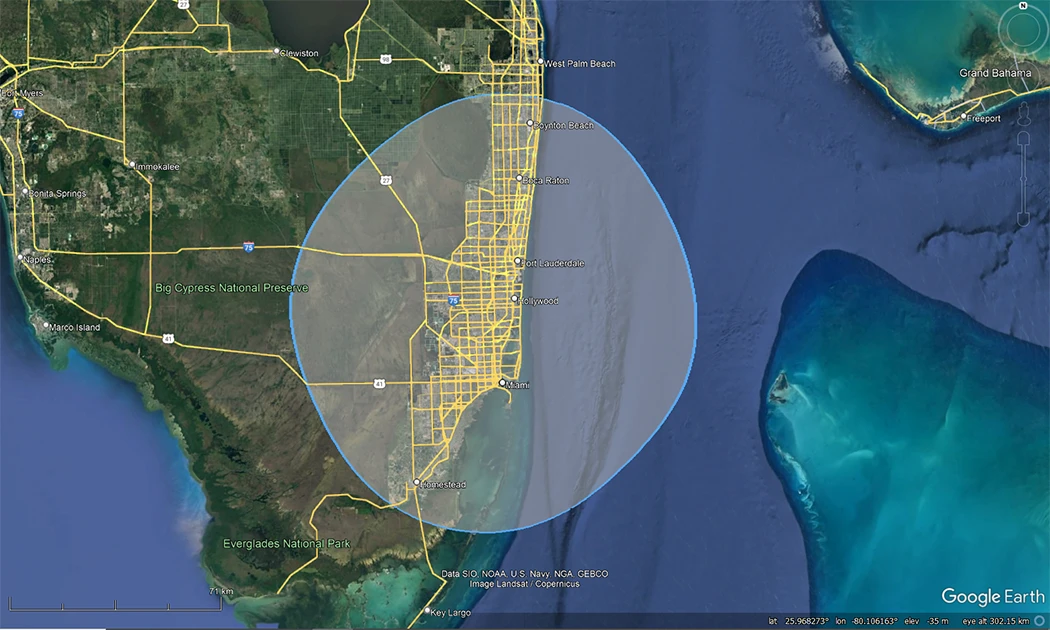
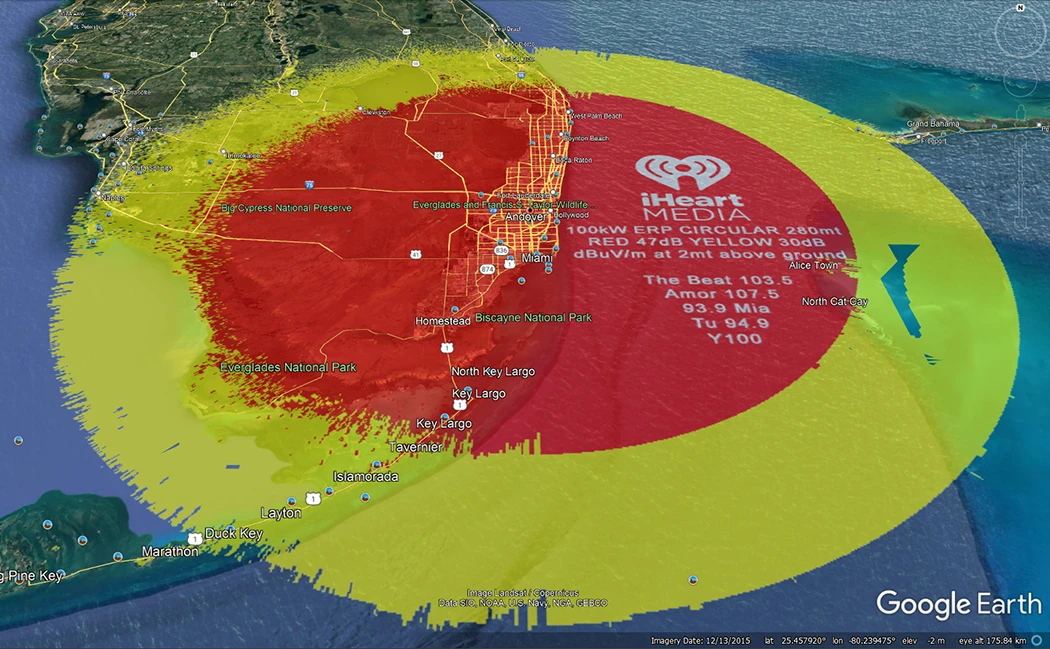
Let's compare the plots that we produce using the SRTM Shuttle Radar Data with FM service contours that the United States FCC produce using their propagation curves. This example is based on the 100kW ERP FM services by iHeartMedia from the 300m tower at Andover in Miami. The RED part of our plot is at 47dBuV/m which is 20 times lower in power than the FCC 60dBuV/m contour show with the blue border in the image directly below. This is why our plots show a little more coverage than the FCC contour.
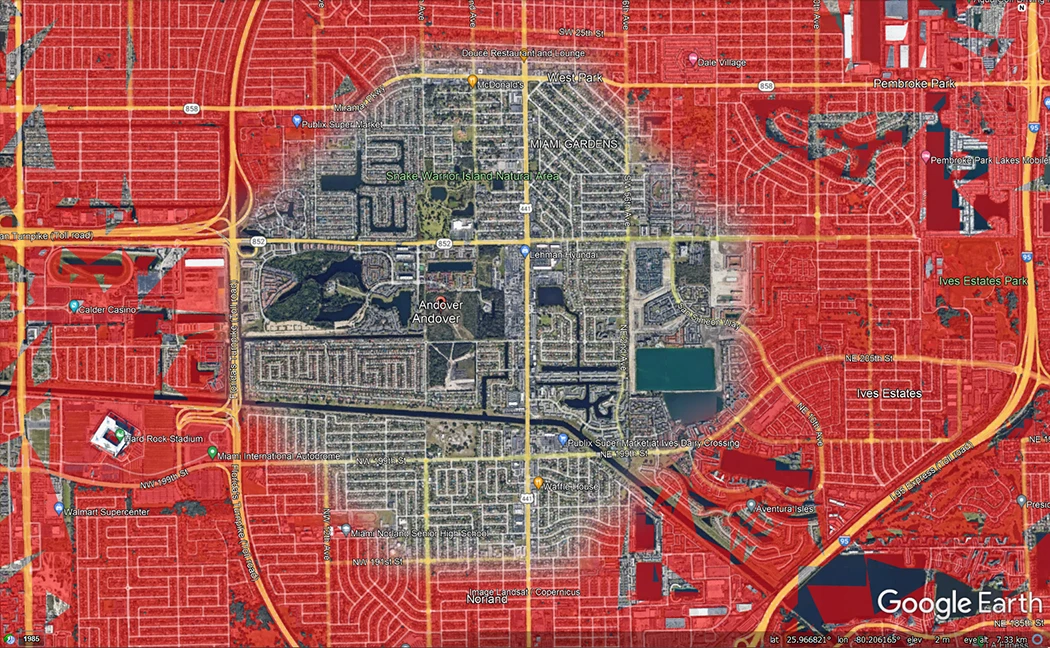
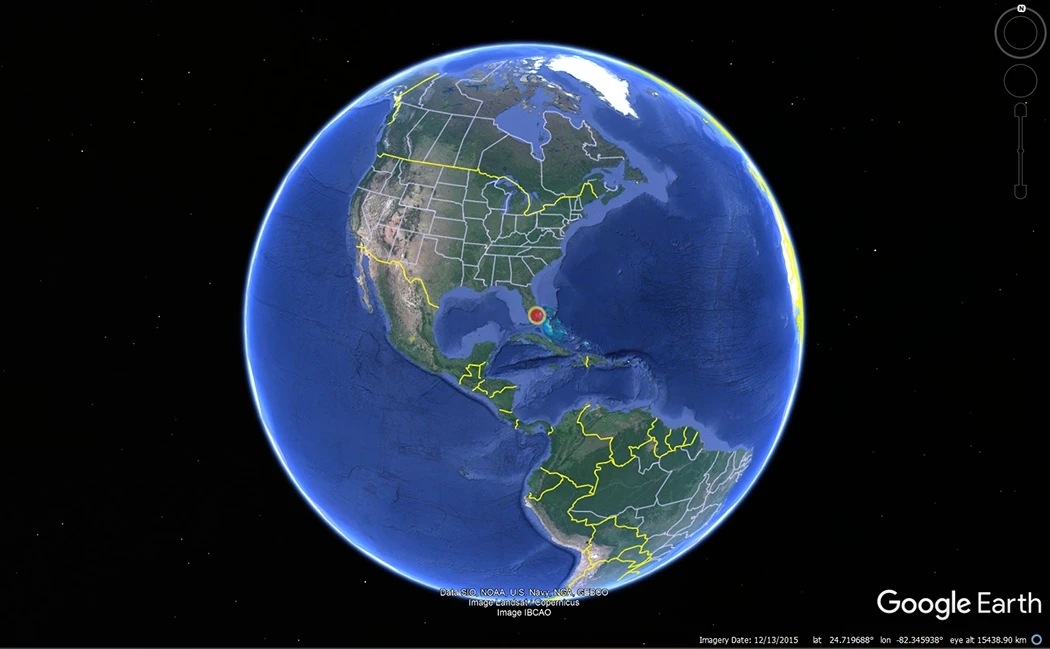
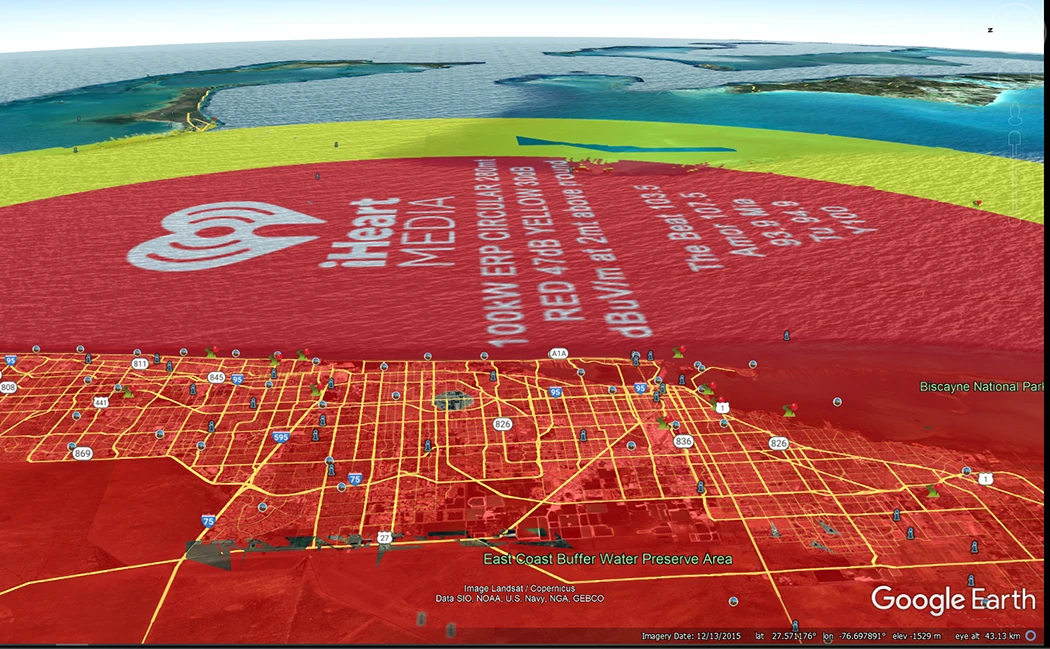
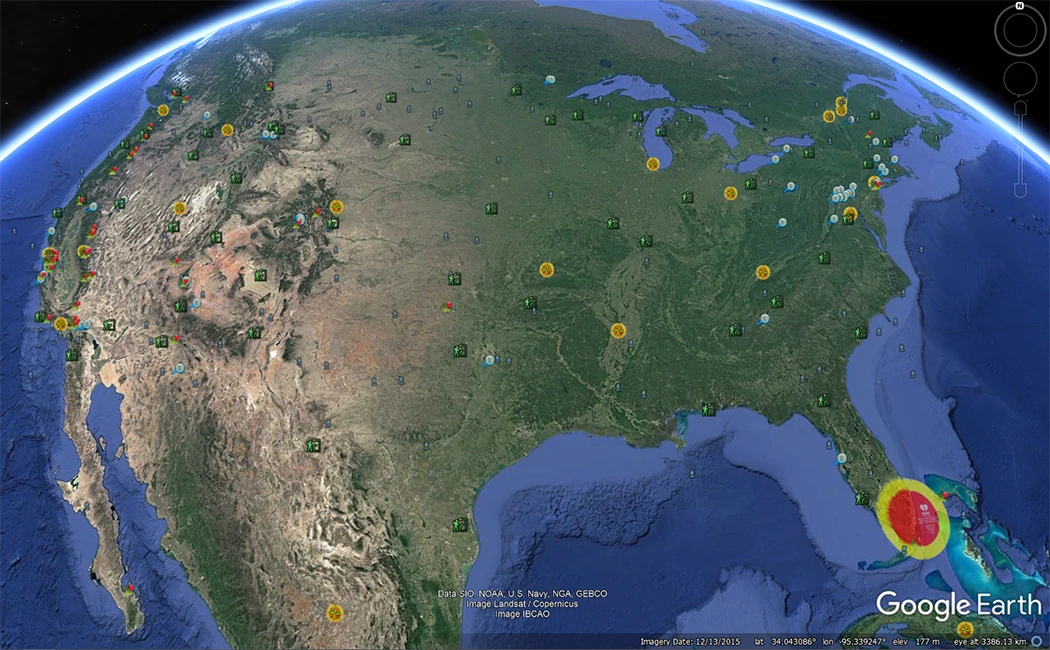
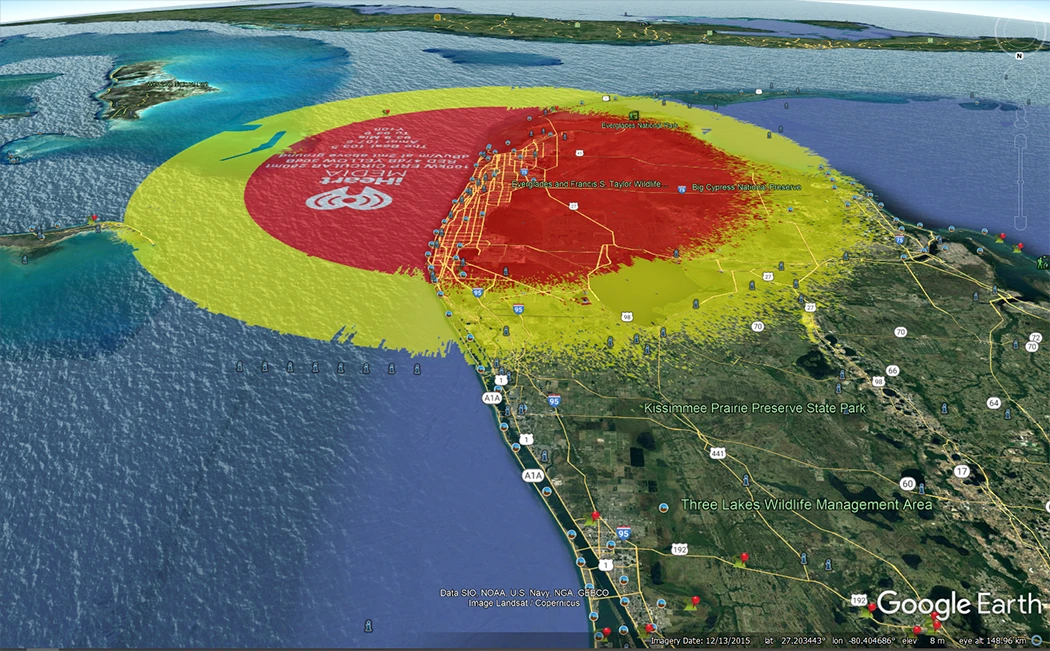
Keep scrolling down and you will see spectacular images of the radiation pattern covering Miami from various angles zoomed in and out.
On our plots the RED part is where the signal is 47dBuV/m at 2m above ground, this coincides with a typical car radio antenna. At 47dBuV/m the signal should be high quality and noise free. In the yellow area the signal will start to fade and get scratchy as it reduces to around 30dBuV/m and eventually disappears completely into the noise.
If you install Google Earth for Desktop here, then download the KMZ file here you can view these images in 3D in Google Earth, with pan tilt, zoom in out etc.